Table overview in the Imaging pipeline
Conceptually, the Imaging pipeline is broken up into four major components:
Session overview and raw data
Image Analysis: Cells and their activity
Tracking: Mouse behaviour data
Processed Analysis: Everything that deals with “Image Analysis” and “Tracking” above and eventually leads to calculation of scores, e.g. gridscore.
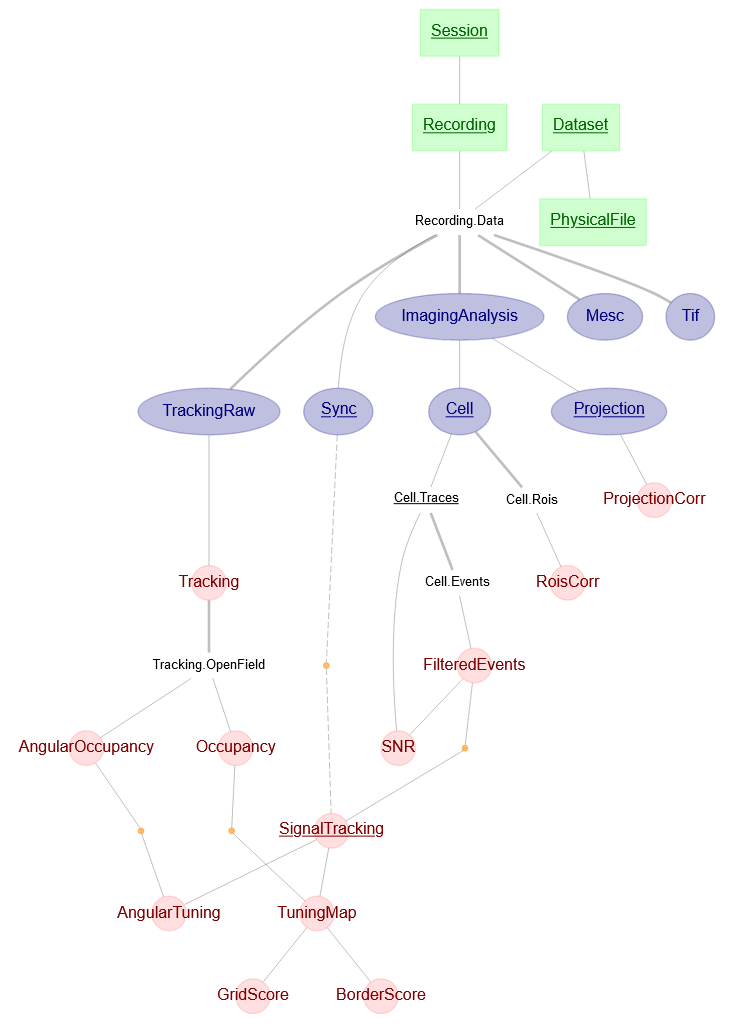
These are the core tables of which to be aware. The imaging pipeline contains many more tables in total (which can be displayed visually via datajoint’s Diagram feature), but these are the main ones you should know about.
Session Overview
The Session overview captures the broadstrokes around the actions of the experimenter and the raw data that is generated.
Session
A Session is the highest-level grouping of experimental activity. A Session contains one (or more) separate activities that shall have all of their data analysed together in some way. A Session takes place with a single subject and a single set of microscope equipment. A Session may be identified by a single session_name attribute.
Recording
A Recording comprises the grouping of a subject performing a single activity (for example, an animal imaged head fixed on a treadmill). It is the smallest time group tracked as a specific object within the pipeline. A Recording typically corresponds to the Experimenter pressing start / stop within the ScanImage software without changing the naming of the saved data. Each recording within a Session may be identified by a unique recording_name attribute.
Recording.Data, Dataset, PhysicalFile
Raw data is tracked per Recording. Each Recording references a number of Datasets. A Dataset is made up of one or more PhysicalFiles.
PhysicalFiles are the lowest level object: these refer to _specific_ files stored on some computer somewhere. PhysicalFiles are tracked by a file repository (e.g. a network storage drive), and their relative path from that file repository.
Datasets comprise related groups of PhysicalFiles. For example, during the course of a long Recording, the calcium imaging data may exceed the maximum size of a tif file and result in the generation of multiple tif files. A DataSet of type TIFRaw would be the grouping all of the tif files together, in the order they were acquired in.
All Datasets are grouped to their respective Recording via the Recording.Data part table. Each Dataset has a unique name (a hash), based on the names of the PhysicalFiles of which it is comprised.
Tif, Sync, Mesc, TrackingRaw
The raw data files are read out in these primary categories. The goal is to extract both actual data that can be used in downstream analysis, as well as descriptive (meta) information. For example, the Tif data coming from the ScanImage system is rich in meta information that is saved in the headers of the tif file: from timing information to image acquisition details.
These data are saved in the Tif.SI part table.
Sync records are data that allow the separate timeseries of each instrument to be synchronised together. For example, imaging data that is acquired at different sample rate than behavioral data.
Mesc is an all-encompassing data format produced by the Femtonics benchtop microscope, and contains both imaging and synchronisation data from that system.
TrackingRaw records raw data about the subject’s behaviour within its environment. Part tables track different kinds of behaviour - for example, two-dimensional movement within an open arena, or one-dimensional movement upon a running wheel. DeepLabCut based video inference data is also stored here.
Each table refers back to a specific Dataset within a Recording.
Handling Imaging Analysis - Suite2p to FilteredSpikes
ImagingAnalysis
ImagingAnalysis captures the intermediate processing of the calcium imaging data. In principle, the pipeline is designed to handle alternate packages, but all data to date has been processed by the Suite2P package. Similarly to the Tif / Tif.SI split discussed above, Suite2P specific metadata is captured in ImagingAnalysis.Suite2py (for “Suite2P python”).
ImagingAnalysis also refers to a specific Dataset within a Recording. Consequently, care must be taken when joining with other Dataset-derived tables under a Recording, as the unique Dataset names may result in otherwise appropriate joins appearing to fail.
Projection, ProjectionCorr
These tables contain the motion-corrected (Projection) and if necessary, un-warped projections of the two-photon imaging stack (ProjectionCorr). Several different projections are offered (mean, max, vmap, etc).
Cell, Cell.Rois, Cell.Traces, Cell.Events, FilteredEvents
Cell and its part tables capture information about each ROI (putative cells) identified by Suite2p (or other analysis package). A cell ID is unique per Session, i.e. reflects the output of Suite2p.
The part tables track different aspects of the ROIs.
Cell.RoisandRoisCorrrecord information (statistics) for each ROI. If the imaging stack involved multiple Z-planes, the plane on which the unit was located is stored here.RoisCorris the unwarped ROI (which is applicable within the projection inProjectionCorr)Cell.Tracesrecords the fluoresence, neuropil, and dF/F trace of the ROIs. Traces are recorded for both primary and secondary channelsCell.Eventsrecords deconvolved activityFilteredEventspresents a filtered view of the deconvolved fluorescence activity (depending on user parameters).
SNR
SNR records the signal to noise ratio of each cell trace.
Animal Tracking: Tracking to SignalTracking
Tracking
Tracking represents the processed outcome of the raw tracking data in its various flavours. Data are stored in appropriate SI units, assuming that calibration data is available. Typically, distances are stored in mm, time in seconds, and angles in degrees. As with TrackingRaw, differnent kinds of data are stored in part tables - linear tracking, openfield tracking, DLC tracking etc.
SignalTracking
SignalTracking matches the calcium activity traces in FilteredEvents to the subject’s behaviour stored in Tracking. Due to the slow acquisition rate of two-photon imaging data, each cell has a unique timeseries generated, based on the location of the cell’s ROI within the two-photon imaging frame, and the scan speed of the laser. The nearest tracking frame is picked out.
Processed Analysis: SignalTracking onwards
Beyond SignalTracking are the various analysis stages on which screening, development, and publications are based. primary tables include:
Occupancy, AngularOccupancy
Histograms of the time spent by the ubject in various states (positions within an arena, pointing angles)
TuningMap
Spatial tuning map (= ratemap in ephys terms)
GridScore
Calculation of the gridness score of a unit